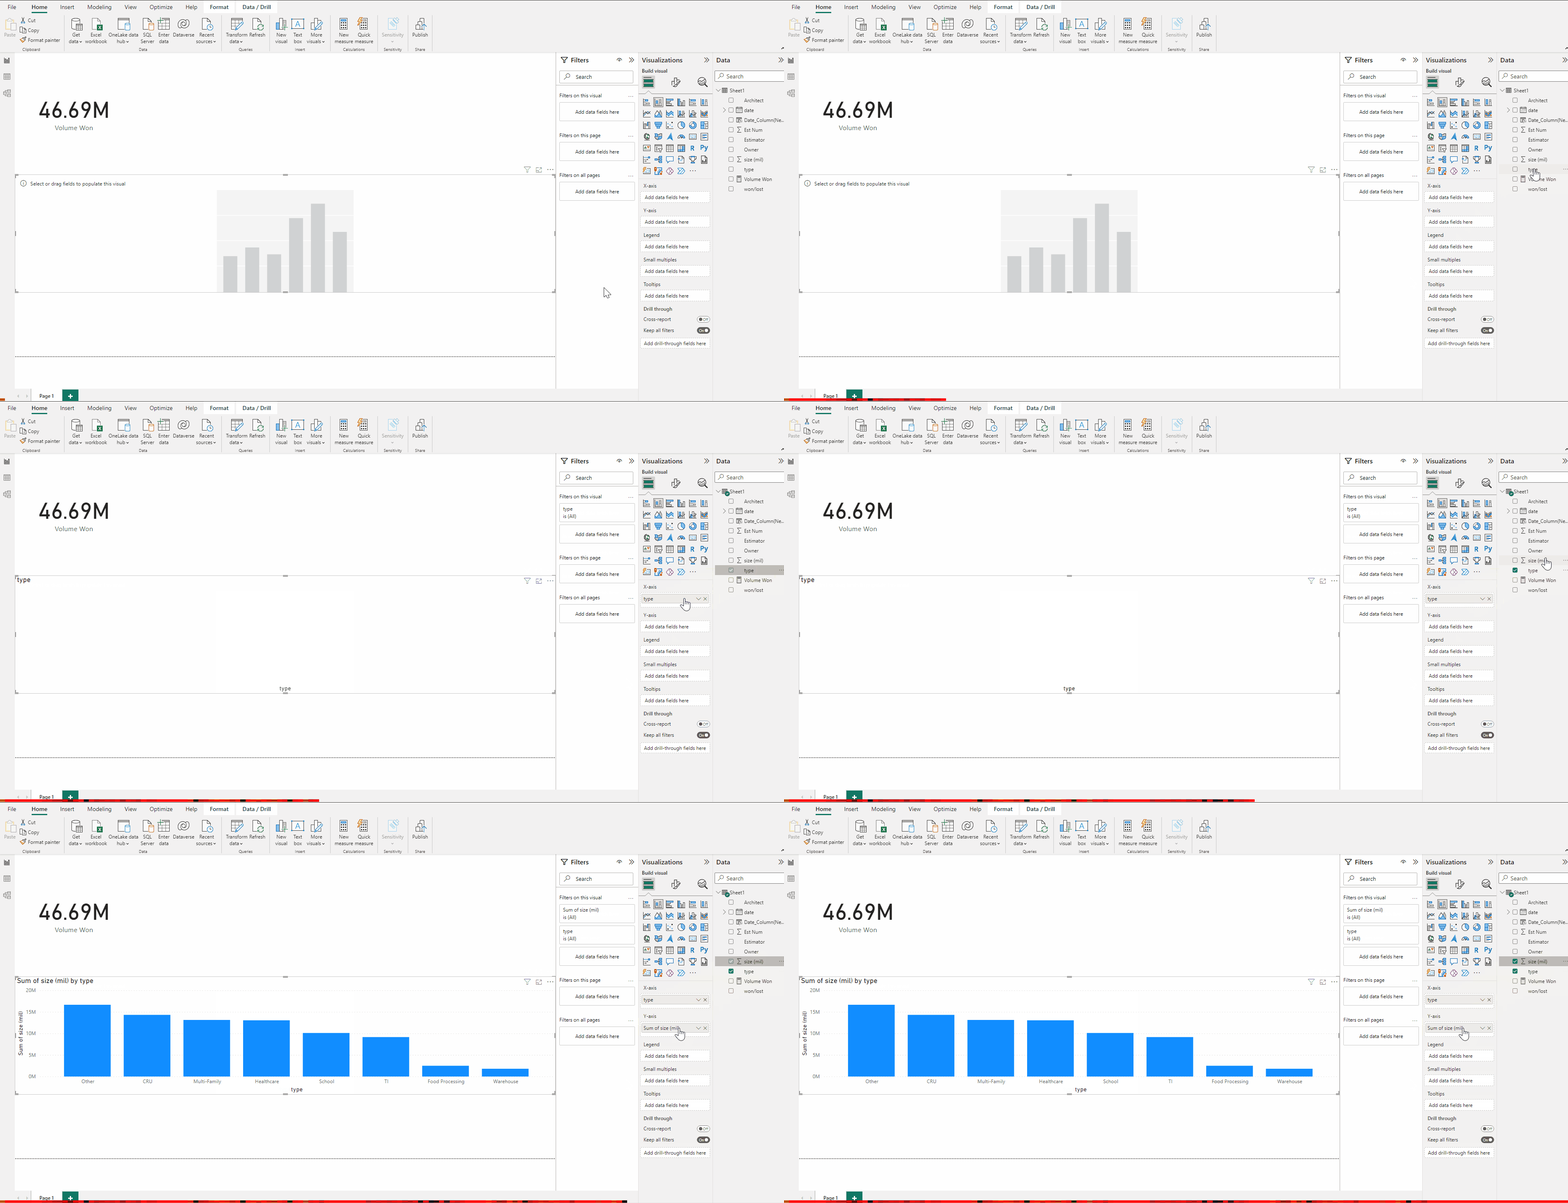
File:Power BI - Visualizations - Adding fields to bar chart demonstration.gif
Jump to navigation
Jump to search
Size of this preview: 800 × 409 pixels. Other resolution: 1,909 × 977 pixels.

Original file (1,909 × 977 pixels, file size: 423 KB, MIME type: image/gif, looped, 150 frames, 10 s)
Note: Due to technical limitations, thumbnails of high resolution GIF images such as this one will not be animated.
Power BI - Visualizations - Adding fields to bar chart demonstration
File history
Click on a date/time to view the file as it appeared at that time.
| Date/Time | Thumbnail | Dimensions | User | Comment | |
|---|---|---|---|---|---|
| current | 14:53, 29 June 2023 | | 1,909 × 977 (423 KB) | Carsen der (talk | contribs) |
You cannot overwrite this file.
File usage
The following page uses this file:
